
The Global 100 list: How the world’s most sustainable corporations are driving the green transition

Published on January 17, 2024

As 2023 came to a close, the World Meteorological Organization declared it to be the hottest year on record. One week later, the Global Carbon Project shared more discouraging news: that despite global pledges to reduce emissions, greenhouse gases from fossil fuels hit a record high again in 2023. 

As the climate crisis exacts a punishing toll around the globe, we’re also getting better at solving problems. Corporate leaders are flowing a growing share of their revenues into investments that will accelerate the green transition, according to Corporate Knights research.

Now in its 20th year, Corporate Knights’ Global 100 ranking of the world’s most sustainable companies reveals the top firms that are increasing their investments in green solutions such as renewable energy, energy efficiency and the circular economy.

“When we launched the Global 100 in 2005, the green economy was a quaint idea. Many companies didn’t publish in-house sustainability reports. There were no standardized key performance indicators, and none of the companies were reporting the percentage of their revenue or investments that were green,” says Corporate Knights co-founder and CEO Toby Heaps. “We did the best job possible with limited qualitative corporate disclosure.”

“Now we can measure this green business exposure for the majority of companies and are able to count annual green investments that run into the trillions, growing six times faster than the economy at large,” Heaps says.

While many companies, particularly in the fossil fuel and banking sectors, resist any major departure from their lucrative business-as-usual path, the leaders are doubling down on sustainability. 

In the 2024 Global 100 ranking, the top-ranked firms allocated 55% of their investments to sustainable projects, up from 47% the year prior. That compares with sustainable investments at a paltry 17% among the broader universe of publicly traded companies with more than US$1 billion in annual revenue.

When we launched this ranking in 2005, the green economy was a quaint idea.

–Toby Heap, co-founder and CEO, Corporate Knights

The increase in sustainable investment is a welcome sign that companies are changing course. “The fact that these companies are plowing more money into sustainable capital expenditure and R&D means that we expect them to have higher sustainable revenues in the near future,” says Matthew Malinsky, research manager for Corporate Knights.

2024 Global 100 ranking 

2024 rank 2023 rank Company HQ location Peer group Carbon productivity % Taxes paid CEO to average worker pay ratio % Gender-diverse board of directors % Sustainable revenue % Sustainable investment Final grade Climate commitments
1 14 Sims Ltd Mascot, Australia Waste management $ 38,525 16% 36:1 38% 100% 100% A+
2 3 Brambles Ltd Sydney, Australia Furniture and general manufacturing $ 123,791 12% 61:1 36% 100% 100% A 1.5°C, SBTi
3 2 Vestas Wind Systems A/S Aarhus, Denmark Machinery manufacturing $ 141,969 19% 70:1 42% 100% 100% A 1.5°C, SBTi
4 9 Taiwan High Speed Rail Corp Taipei, Taiwan Transit and ground transportation $ 7,698 0% 11:1 15% 100% 100% A
5 Nordex SE Hamburg, Germany Machinery manufacturing $ 160,887 73% 82:1 33% 100% 100% A 1.5°C, SBTi
6 15 Banco do Brasil SA Brasília, Brazil Banks $ 1,106,800 17% 9:1 50% 29% 0% A- 1.5°C, SBTi
7 7* Schneider Electric SE Rueil-Malmaison, France Electrical equipment manufacturing $ 102,400 16% 97:1 50% 72% 80% A- 1.5°C, SBTi
8 18 Chr Hansen Holding A/S Hørsholm, Denmark Food and beverage manufacturing $ 38,696 14% 34:1 50% 47% 71% A- 1.5°C, SBTi
9 7 Stantec Inc Edmonton, Canada Business, engineering and personal services $ 118,360 12% 60:1 50% 59% 60% A- 1.5°C, SBTi
10 SMA Solar Technology AG Niestetal, Germany Semiconductor and electronic components manufacturing $ 135,701 22% 15:1 33% 100% 1% A- SBTi
11 5 Autodesk Inc San Francisco, U.S. IT services except telecom and hosting $ 517,478 19% 50% 93% 0% A- 1.5°C, SBTi
12 WSP Global Inc Montreal, Canada Business, engineering and personal services $ 152,031 16% 109:1 33% 57% 92% B+ 1.5°C, SBTi
13 Clean Harbors Inc Norwell, U.S. Waste management $ 3,048 8% 45% 100% 100% B+ 1.5°C, SBTi
14 Enphase Energy Inc Fremont, U.S. Semiconductor and electronic components manufacturing $ 209,362 4% 14% 100% 100% B+
15 65 Telefonaktiebolaget LM Ericsson Stockholm, Sweden Telephones and telecom equipment manufacturing $ 174,040 18% 83:1 29% 47% 71% B+ 1.5°C, SBTi
16 35 SunPower Corp Richmond, U.S. Semiconductor and electronic components manufacturing 0% 22% 100% 100% B+ SBTi
17 13 Ørsted A/S Fredericia, Denmark Power generation $ 8,192 10% 35:1 50% 65% 99% B+ 1.5°C, SBTi
18 Alstom SA Saint-Ouen, France Non-road transport equipment manufacturing $ 111,827 11% 31:1 38% 84% 92% B+ SBTi
19 29 Neste Oyj Espoo, Finland Refining, petrochemicals and basic organic chemicals $ 15,844 10% 14:1 25% 39% 92% B+
20 10 Dassault Systèmes SE Vélizy-Villacoublay, France IT services except telecom and hosting $ 318,772 14% 27:1 50% 66% 6% B+ 1.5°C, SBTi
21 51 Giant Manufacturing Co Ltd Taichung, Taiwan Non-road transport equipment manufacturing $ 56,418 18% 227:1 9% 100% 100% B+
22 28 City Developments Ltd Singapore, Singapore Real estate $ 25,789 17% 38:1 20% 54% 64% B+ 1.5°C, SBTi
23 Trane Technologies PLC Swords, Ireland HVAC equipment manufacturing $ 44,213 25% 126:1 45% 38% 29% B+ 1.5°C, SBTi
24 United Utilities Group PLC Warrington, U.K. Water and sewage treatment $ 10,544 3% 71:1 40% 42% 100% B+ 1.5°C, SBTi
25 XPeng Inc Guangzhou, China Cars and trucks manufacturing, including parts $ 264,119 0% 14% 100% 100% B
26 Wheaton Precious Metals Corp Vancouver, Canada Asset management $ 33,251,733 0% 5:1 30% 21% 0% B SBTi
27 4 Brookfield Renewable Partners LP Hamilton, Bermuda Power generation $ 25,165 4% 58:1 33% 97% 100% B
28 54 ERG SpA Genoa, Italy Power generation $ 2,342 9% 22:1 42% 52% 100% B 1.5°C, SBTi
29 74 Kesko Oyj Helsinki, Finland Grocery stores $ 124,317 9% 110:1 29% 3% 10% B 1.5°C, SBTi
30 Risen Energy Co Ltd Ningbo, China Semiconductor and electronic components manufacturing $ 14,582 23% 21:1 0% 100% 100% B
31 58 Severn Trent PLC Coventry, U.K. Water and sewage treatment $ 5,751 2% 64:1 56% 50% 100% B 1.5°C, SBTi
32 Hydro One Ltd Toronto, Canada Power transmission and distribution $ 19,867 1% 9:1 40% 36% 98% B
33 Zhuzhou CRRC Times Electric Co Ltd Zhuzhou, China Electrical equipment manufacturing 28% 9% 100% 100% B
34 46 First Solar Inc Tempe, U.S. Semiconductor and electronic components manufacturing $ 4,270 15% 25% 100% 100% B 1.5°C, SBTi
35 53 Eisai Co Ltd Tokyo, Japan Pharmaceutical and biotech manufacturing $ 188,590 16% 10:1 18% 49% 22% B 1.5°C, SBTi
36 1 Radius Recycling Portland, U.S. Waste management $ 19,067 5% 103:1 50% 95% 100% B
37 87 Beazley PLC London, U.K. Insurance companies $ 2,864,982 10% 11:1 45% 15% 0% B NZIA
38 20 Cascades Inc Kingsey Falls, Canada Packaging $ 4,763 3% 66:1 38% 88% 86% B SBTi
39 EDP Renováveis SA Madrid, Spain Power generation 2% 7:1 33% 100% 100% B SBTi
40 32 Beijing Enterprises Water Group Ltd Hong Kong, China Water and sewage treatment $ 3,828 8% 20% 94% 100% B
41 49 Atea ASA Oslo, Norway Computers and peripherals manufacturing $ 483,930 12% 23:1 38% 57% 38% B SBTi
42 64 Yadea Group Holdings Ltd Wuxi, China Non-road transport equipment manufacturing $ 49,209 8% 7:1 13% 100% 100% B
43 Li Auto Inc Beijing, China Cars and trucks manufacturing, including parts $ 107,512 3% 95:1 13% 100% 100% B-
44 69 Maxeon Solar Technologies Ltd Singapore, Singapore Semiconductor and electronic components manufacturing $ 4,422 8% 0% 100% 100% B-
45 31 Kering SA Paris, France Retail, except grocery and auto $ 261,469 28% 151:1 46% 26% 5% B- 1.5°C, SBTi, FCCA
46 86 Tesla Inc Austin, U.S. Cars and trucks manufacturing, including parts $ 133,544 6% 25% 100% 100% B- 1.5°C, SBTi
47 Umicore SA Brussels, Belgium Basic inorganic chemicals and synthetics $ 57,259 17% 32:1 40% 12% 63% B- SBTi
48 41 SAP SE Walldorf, Germany IT services except telecom and hosting $ 168,329 28% 30:1 44% 30% 3% B- 1.5°C, SBTi
49 22 McCormick & Company Inc Hunt Valley, U.S. Food and beverage manufacturing $ 80,976 14% 36% 46% 22% B- 1.5°C, SBTi
50 79 NIO Inc Shanghai, China Cars and trucks manufacturing, including parts $ 42,750 1% 17% 100% 100% B-
51 42 BCE Inc Verdun, Canada Telecom providers $ 75,217 8% 137:1 36% 24% 78% B- 1.5°C, SBTi
52 76 Investec Ltd Sandton, South Africa Banks $ 130,634 20% 43:1 43% 14% 0% B- NZBA
53 Novo Nordisk A/S Bagsvaerd, Denmark Pharmaceutical and biotech manufacturing $ 336,603 19% 76:1 46% 4% 0% B- 1.5°C, SBTi
54 47 Puma SE Erlangen, Germany Textiles and clothing manufacturing $ 312,773 17% 226:1 33% 54% 0% B- SBTi, FCCA
55 63 Samsung SDI Co Ltd Yongin-si, South Korea Semiconductor and electronic components manufacturing $ 14,103 9% 135:1 29% 87% 94% B-
56 Rivian Automotive, Inc Irvine, U.S. Cars and trucks manufacturing, including parts 0% 55:1 43% 100% 100% B-
57 59 Intesa Sanpaolo SpA Turin, Italy Banks $ 195,778 26% 102:1 42% 16% 0% B- 1.5°C, SBTi, NZBA
58 23 Novozymes A/S Bagsvaerd, Denmark Pharmaceutical and biotech manufacturing $ 7,348 16% 35:1 27% 67% 14% C+ 1.5°C, SBTi
59 Elisa Oyj Helsinki, Finland Telecom providers $ 57,863 11% 31:1 38% 16% 63% C+ 1.5°C, SBTi
60 89 Arçelik AS Istanbul, Turkey Appliances and lighting fixtures manufacturing $ 224,900 6% 17% 10% 15% C+ 1.5°C, SBTi
61 Pirelli & C SpA Milan, Italy Plastic and rubber product manufacturing $ 14,318 12% 548:1 20% 23% 16% C+ 1.5°C, SBTi
62 Singapore Telecommunications Ltd Singapore, Singapore Telecom providers $ 37,135 7% 28:1 43% 12% 60% C+ 1.5°C, SBTi
63 12 Xinyi Solar Holdings Ltd Wuhu, China Glass and ceramics $ 891 10% 213:1 11% 100% 100% C+
64 48 Cisco Systems Inc San Jose, U.S. Telephones and telecom equipment manufacturing $ 86,080 22% 366:1 42% 42% 0% C+ 1.5°C, SBTi
65 68 KB Financial Group Inc Seoul, South Korea Banks $ 142,713 25% 11:1 33% 6% 0% C+ 1.5°C, SBTi, NZBA
66 61 Sanofi SA Paris, France Pharmaceutical and biotech manufacturing $ 93,914 17% 98:1 38% 27% 10% C+ 1.5°C, SBTi
67 39 HP Inc Palo Alto, U.S. Computers and peripherals manufacturing $ 259,083 15% 787:1 46% 78% 0% C+ 1.5°C, SBTi
68 52 Essity AB (publ) Stockholm, Sweden Packaging $ 6,803 13% 65:1 38% 33% 10% C+ 1.5°C, SBTi
69 Equinix Inc Redwood City, U.S. Data processing, hosting services $ 2,970 4% 40% 48% 1% C+ SBTi
70 Unibail-Rodamco-Westfield SE Paris, France Real estate $ 29,790 4% 26:1 50% 50% 8% C+ 1.5°C, SBTi
71 73 Apple Inc Cupertino, U.S. Telephones and telecom equipment manufacturing $ 351,888 16% 33% 70% 1% C+ 1.5°C, SBTi
72 80 Ricoh Co Ltd Tokyo, Japan Computers and peripherals manufacturing $ 70,161 19% 17:1 13% 51% 34% C+ 1.5°C, SBTi
73 45 Cogeco Communications Inc Montreal, Canada Telecom providers $ 77,783 6% 54:1 50% 26% 28% C+ 1.5°C, SBTi
74 Solaredge Technologies Inc Herzliya, Israel Semiconductor and electronic components manufacturing $ 73,903 19% 50% 94% 43% C+
75 Telefônica Brasil SA São Paulo, Brazil Telecom providers $ 250,602 2% 90:1 33% 12% 53% C+
76 38 Unilever PLC London, U.K. Personal products (retail chemical) $ 53,579 23% 98:1 38% 2% 4% C+ 1.5°C, SBTi
77 36 Xerox Holdings Corp Norwalk, U.S. Computers and peripherals manufacturing $ 56,147 6% 25% 75% 11% C 1.5°C, SBTi
78 43 Coloplast A/S Humlebæk, Denmark Medical equipment manufacturing $ 71,029 19% 43:1 33% 9% 0% C 1.5°C, SBTi
79 77 Sun Life Financial Inc Toronto, Canada Insurance companies $ 549,255 15% 124:1 50% 6% 0% C
80 34 StarHub Ltd Singapore, Singapore Telecom providers $ 50,109 13% 17:1 25% 8% 57% C 1.5°C, SBTi
81 67 Hewlett Packard Enterprise Co Spring, U.S. Computers and peripherals manufacturing $ 93,302 7% 46% 33% 39% C 1.5°C, SBTi
82 72 Svenska Handelsbanken AB Stockholm, Sweden Banks $ 1,052,698 26% 17:1 57% 7% 0% C 1.5°C, SBTi, NZBA
83 94 Nordea Bank Abp Helsinki, Finland Banks $ 3,242,058 10% 35:1 50% 4% 0% C NZAM, NZAO, NZBA
84 70 Orkla ASA Oslo, Norway Food and beverage manufacturing $ 33,788 17% 17:1 45% 23% 3% C 1.5°C, SBTi
85 37 Telus Corp Vancouver, Canada Telecom providers $ 64,565 8% 338:1 43% 26% 23% C 1.5°C, SBTi
86 81 Henkel AG & Co KgaA Düsseldorf, Germany Personal products (retail chemical) $ 58,936 19% 132:1 44% 21% 1% C 1.5°C, SBTi, NZAM
87 Prologis Inc San Francisco, U.S. Real estate and leasing $ 1,614,690 3% 170:1 27% 2% 4% C 1.5°C, SBTi
88 UniCredit SpA Milan, Italy Banks $ 225,131 10% 60:1 42% 10% 0% C NZBA
89 85 Commerzbank AG Frankfurt am Main, Germany Banks $ 423,236 16% 36:1 45% 5% 0% C SBTi, NZAM, NZBA
90 71 BNP Paribas SA Paris, France Banks $ 320,421 13% 55:1 53% 8% 0% C SBTi, NZAM, NZAO, NZBA
91 Assicurazioni Generali SpA Trieste, Italy Insurance companies $ 1,273,258 25% 72:1 46% 3% 0% C NZIA
92 78 Teck Resources Ltd Vancouver, Canada Metal and coal mining $ 4,846 13% 79:1 29% 19% 28% C
93 27 Vitasoy International Holdings Ltd Hong Kong, China Food and beverage manufacturing $ 9,681 14% 70:1 18% 46% 4% C
94 Bank of China Ltd Beijing, China Banks $ 100,123 13% 4:1 15% 17% 0% C
95 97 AstraZeneca PLC Cambridge, U.K. Pharmaceutical and biotech manufacturing $ 100,380 15% 111:1 38% 13% 0% C- 1.5°C, SBTi
96 92 IGM Financial Inc Winnipeg, Canada Asset management $ 4,947,231 17% 49:1 33% 3% 0% C- NZAM
97 Biomérieux SA Marcy l’Étoile, France Medical equipment manufacturing $ 75,374 18% 18:1 44% 6% 0% C- SBTi
98 Manulife Financial Corp Toronto, Canada Insurance companies $ 206,669 11% 155:1 58% 6% 0% C- 1.5°C, SBTi
99 57 Sino Land Co Ltd Hong Kong, China Real estate $ 10,127 20% 50:1 8% 50% 12% C- 1.5°C, SBTi
100 Sysmex Corp Kobe, Japan Instrumentation and other electronic manufacturing $ 154,501 20% 22:1 8% 37% 0% C- SBTi

*Indicates a tie as a result of a data correction

Note: Banks, asset management and insurance peer groups are not assessed on the sustainable investment KPI. The weight of this KPI has been reweighted to the sustainable revenue KPI.

The 2024 Global 100 companies earned 51% of their revenues from sustainable sources in the fiscal year 2022, up from 50% the prior year. That compares with just 16% for the broader universe of companies. 

“Sustainable investment data identifies those companies that are going to be poised to succeed in the transition to a low-carbon economy,” Malinsky says. “We can see which of these companies are going all in on sustainable investment and have watched the ratio grow for some of these companies from 20, to 30, to 50% over a three-year period.”

Two Australian companies, Sims Ltd. and Brambles Ltd., top the 2024 ranking. Sims recycles scrap metal in 30 countries, and Brambles rents recycled shipping pallets and containers around the globe. Both companies score 100% on sustainable revenue and sustainable investment.

> >READ OUR TOP COMPANY PROFILE

Malinsky says that the success of Sims and Brambles is emblematic of the growing number of companies associated with the circular economy, in which waste streams are recycled into new products. 

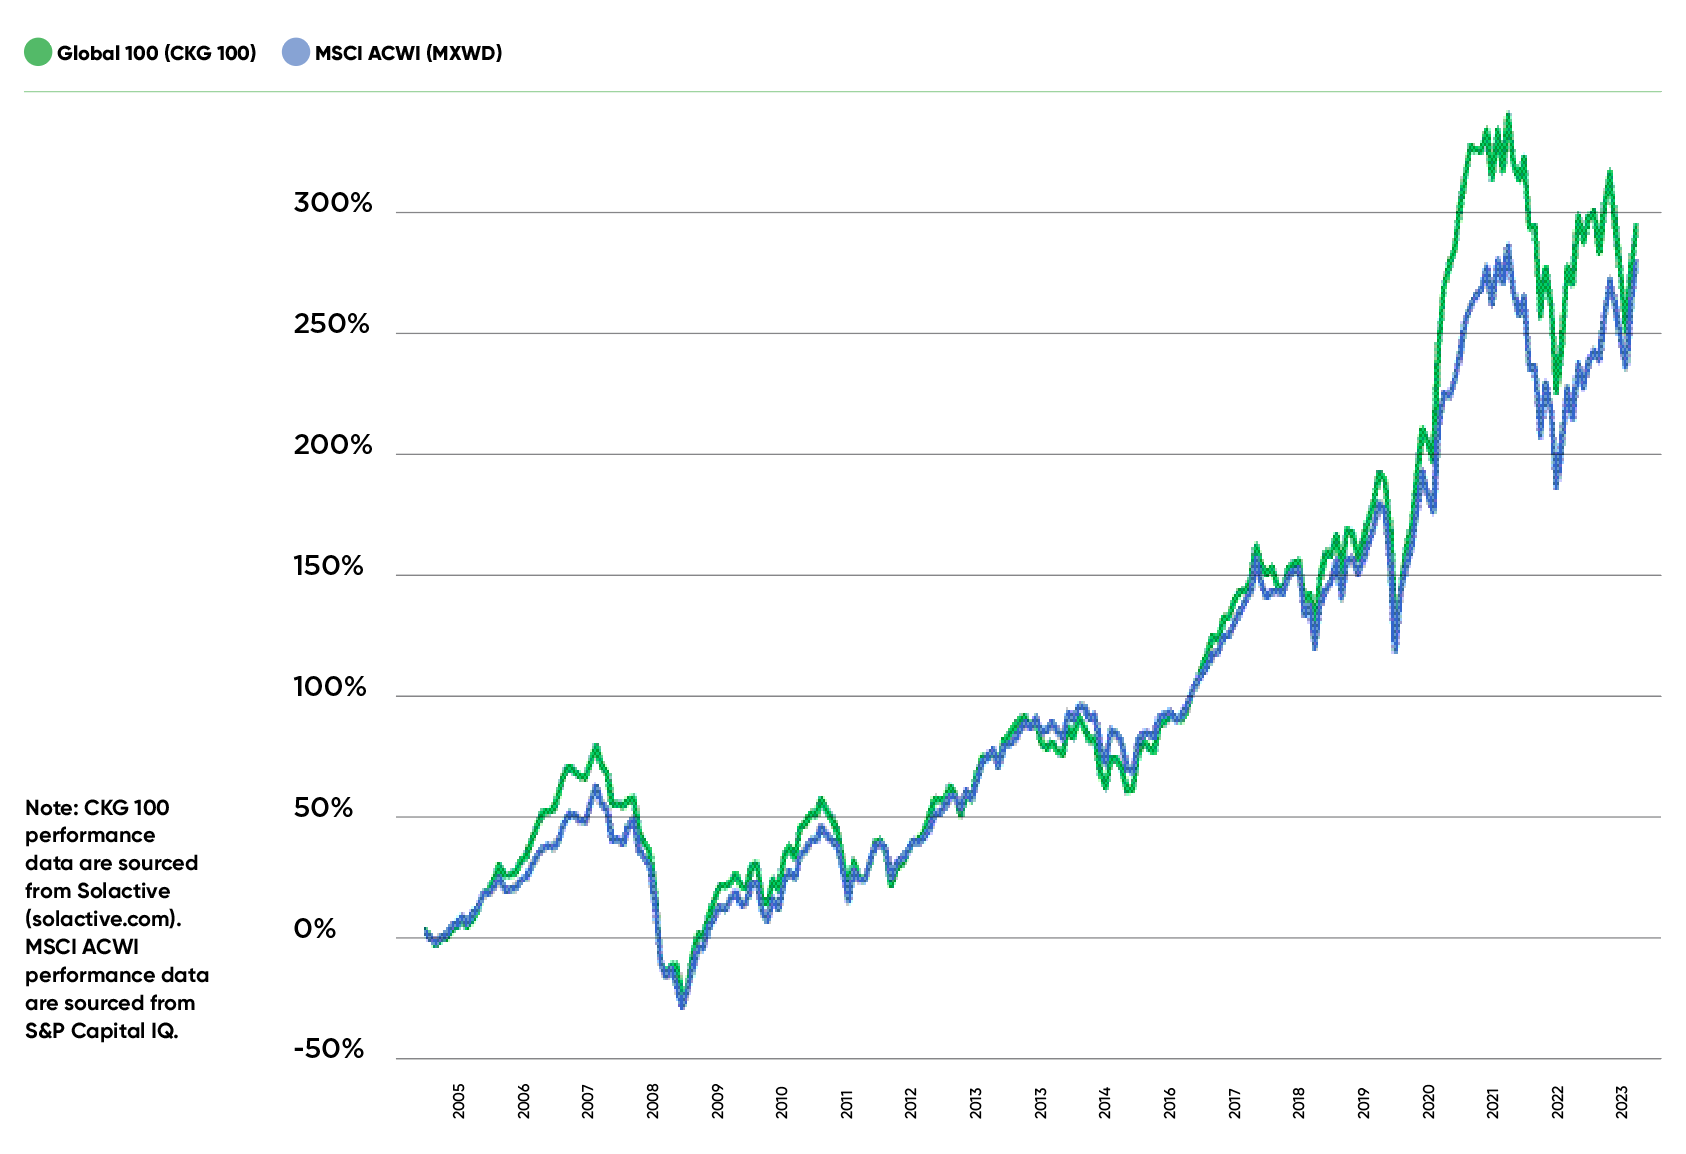
Two decades of Global 100 versus benchmark
The Global 100 also awarded a “pivot prize” to Italian energy firm ERG SpA, which completed its multiyear transition from black to green halfway through 2023. ERG had sold off its oil assets in 2013 and announced the divestiture of its gas assets in 2022 but was blocked by Italy’s anti-trust regulator. The company redoubled its efforts to sell its last non-renewable assets and finally sold its gas-fired power plant to Achernar Assets in June 2023. 

“With this operation we complete the path of transformation towards a pure wind and solar business model,” ERG CEO Paolo Merli said in a statement. 

ERG landed in 28th place on the 2024 Global 100 and will no doubt move up the rankings next year.

As its chair Edoardo Garrone said in a statement to investors, “We have shown that the transition to a sustainable business model is possible and profitable.”

 Among the Canadian firms to make the Global 100 are engineering firms Stantec of Edmonton and WSP Global, based in Montreal. First-time Canadian entries include Ontario’s transmission company Hydro One and life insurance giant Manulife Financial Corp., which joins its competitor Sun Life Financial Inc. on the list.

We have shown that the transition to a sustainable business model is profitable and possible.

-Edoardo Garrone, chair, ERG

The Global 100 rates companies in 38 industry groups, including banking, utilities, mining, oil and gas, and manufacturing, based on 25 metrics. It applies different weighting to certain metrics given the nature of the sector. Sustainable revenue and sustainable investment are key measures; others include gender and racial diversity, CEO pay versus employee average, CEO bonuses based on sustainability performance, taxes paid and contributions to employee pensions.

The Global 100 score far better on overall environmental, social and governance (ESG) metrics than do their peers. For example, 79% of Global 100 firms had sustainability-linked pay; only 30% of the broader corporate universe linked executive pay to the achievement of environmental or social sustainability targets.

It is a similar story for gender and racial diversity, though the difference is less stark. Some 35% of Global 100 boards of directors are gender diverse, while 25% of the broader peer group had gender-diverse boards. (Manulife was a leader with 58.3 % of its board listed as gender diverse.)

Racial diversity continues to lag both in the Global 100 group and the larger universe of companies. Only 13% of Global 100 company board directors were racially diverse compared to 10% for the larger cohort. 

All told, 10 global banks are represented in the Global 100, reflecting the large presence of financial institutions on the All Country World Index (MSCI ACWI) of publicly traded companies. The 10 banks on the Global 100 are leaders in their sector.

While the two Canadian life insurance companies made the cut, no Canadian bank did. In fact, Bank of Montreal fell out of the ranking after making it last year. The Bank of Montreal “has been pretty stagnant over the last few years in terms of their exposure to sustainable financing,” Malinsky says. 

Stagnation helps explain why a number of other companies fell off the list this year – to remain leaders, corporations need to continue to up the ante. “A number of other banks in the universe have seen their proportion of sustainable revenues earned from sustainable financing activities grow quite significantly, ” Malinsky adds.

As leaders in corporate sustainability, the Global 100 companies have also provided attractive investment returns for their shareholders. Corporate Knights compared the returns on its Global 100 index against the MSCI ACWI Index.

Between February 1, 2005, and December 15, 2023, the Global 100 saw a return of 287% on a U.S. dollar basis, while the MSCI ACWI had a return of 272%. The Dow Jones Sustainability World Index posted a return of 254% over that period.

The profitability of and solid investment returns from sustainability leaders are critical signals to the laggards that doing well can go hand in hand with doing good. And indeed, a growing number of investors are demanding greater transparency on data in order to align their investment and underwriting with their environmental and social commitments. 

Nowhere is that more true than with regard to climate change and the clean energy transition. Leaders in the transition will be rewarded and laggards penalized as the growing crisis drives governments and businesses alike to reassess their strategic interests and align their plans with a net-zero world. 
CLIMATE
COMMITMENTS
1.5˚C

Business Ambition for 1.5˚C

SBTi

Science Based Targets Initiative

FCCA

Fashion Charter for Climate Action

NZAM

Net-Zero Asset Managers Initiative

NZAO

Net-Zero Asset Owners Alliance

NZBA

Net-Zero Banking Alliance

DOWNLOAD FULL RESULTS

Get the complete Excel scorecard for the Global 100 most sustainable companies of 2023

Methodology

 All companies are scored on applicable metrics relative to their peers, with 50% of the weight assigned to sustainable revenue and sustainable investment. Nine of the indicators have fixed weights; the rest are assigned weights according to each industry’s relative impact in relation to the overall economy. After quantitatively analyzing data for 25 key performance indicators, using the Corporate Knights methodology, this year’s overall scores were converted to letter grades. 

HQ location: Where the company’s headquarters are located

Peer group: Peer group against which company was rated (based on the Corporate Knights peer groups)

Peer group rank: Company’s ranking in peer group

Carbon productivity: Based on company’s revenue to Scope 1+2 CO2e ratio

% Taxes paid: Based on company’s cash taxes paid to profit ratio over past five years

CEO–average worker pay ratio: Ratio of CEO compensation to average worker’s compensation

% Gender-diverse board directors: % of board directors who are not male

% Sustainable revenue: % of revenue earned from products and services that are categorized as “sustainable” under the Corporate Knights Sustainable Economy Taxonomy

% Sustainable investment: % of capital expenditures, R&D and acquisitions that are categorized as “sustainable” under the Corporate Knights Sustainable Economy Taxonomy

Overall score: The weighted average percentile rank scores across up to 25 metrics

Awarded to the top company​

Above 75%

70% - 75%

65% - 70%

60% - 65%

55% - 60%

50% - 55%

45% - 50%

40% - 45%

35% - 40%

30% - 35%

25% - 30%
Evolution of the Global 100 methodology

Since 2005, the Global 100’s objective has been to identify the most sustainable publicly traded companies using a best-in-class approach with sector exposure in line with blue chip indices.

2005-2010
Read More
"Corporate Knights commissioned third party research partner (Innovest Strategic Value Advisors) to compile the Global 100 list"
2011
Read More
"The Global 100 ranking began being generated by Corporate Knights research team with a rules-based methodology using quantitative and transparent key performance indicators based on publicly-available data"
2018
Read More
We introduced the Clean Revenue (now referred to as Sustainable Revenue) indicator and the Impact-Weighted Scoring system whereby the weight assigned to a given key performance indicator varies by industry depending on their activities' impact
2019
Read More
The Sustainable Revenue indicator is given a fixed weight of 50%, underlining a shift in emphasis towards companies at the forefront of the transition to a low-carbon sustainable economy
2021
Read More
"The Sustainable Investment indicator is introduced with a fixed weight of 7.5% and the weight of the Sustainable Revenue indicator's weight is adjusted to 42.5%"
2023
Read More
The Sustainable Investment indicator weight is brought into parity with Sustainable Revenue, both with a fixed weight of 25%. KPI weights and penalties were updated.
Previous
Next

Previous Rankings

2022 GLOBAL 100

2021 GLOBAL 100

2020 GLOBAL 100

2019 GLOBAL 100

The post The Global 100 list: How the world’s most sustainable corporations are driving the green transition appeared first on Corporate Knights.